Skip to content
Chartbrew logo

Chartbrew

Create interactive reports and dashboards from all your data sources for teams and clients.

From $41/mo, free trial
Tracked since 2026

The Bottom Line

Price
From $41/mo, free trial. Compare plans

Key facts

  • Create interactive dashboards and reports from diverse data sources.
  • Utilize AI for natural language data exploration, visualization, and query optimization.
  • Scale client reporting with templates, embedded dashboards, and collaboration features.

Pros

  • Centralizes data from various sources for comprehensive reporting.
  • AI assistant makes data analysis accessible to non-technical users.
  • Streamlines client reporting with templates and embedded dashboards.
  • Optimized for team collaboration and efficient sharing of insights.
  • Offers flexible embedding options for integrating analytics into existing apps.

Cons

  • No free plan available, only a 14-day free trial.
  • Self-hosting is required for a completely free, unlimited experience.
  • Specific integrations are mentioned, but a full list is not immediately visible on the main page.

What is Chartbrew?

Chartbrew is a robust platform designed to help teams and agencies create, manage, and share interactive data dashboards and reports. It centralizes data from various sources, allowing users to visualize key performance indicators (KPIs) and make data-driven decisions. The platform is particularly useful for client reporting, enabling users to build branded dashboards, share insights with clients, and even embed real-time analytics into existing applications. A core feature of Chartbrew is its AI assistant, which facilitates data exploration and visualization through natural language conversations. This AI can answer questions about data, generate charts, and optimize queries for SQL-based databases and MongoDB, making data analysis accessible even to non-technical users. Chartbrew also emphasizes collaboration, offering tools for teams to work together on reports and for easy sharing with stakeholders. With features like report templates, automated updates, and data alerts, it streamlines the process of scaling client reporting and ensuring timely insights. Chartbrew caters to small teams tracking KPIs, growing businesses needing advanced dashboards and client reporting at scale, and agencies or SaaS teams managing multiple clients and large datasets. It aims to replace manual, clunky reporting methods with dynamic, real-time solutions, empowering both internal teams and external clients with actionable insights.

Available on: Web

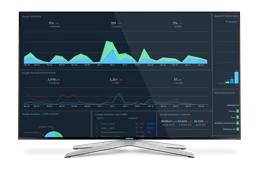
Preview

Key Features

  • Real-time dashboards and reports
  • Client accounts and reporting
  • Data alerts (Slack, email, anomaly detection)
  • Share & Embed dashboards (iframe, API)
  • Conversational AI assistant for data exploration
  • AI-powered query assistant (SQL, MongoDB)
  • Auto-update data refresh intervals
  • Report templates for client replication

Pricing Plans

Free Trial

Pricing checked Nov 12, 2026. Source: chartbrew.com/pricing, read Nov 12, 2026

Chartbrew plans and prices, checked November 2026
Plan Price Details
Starter

$41 / mo

  • 10 Dashboards
  • 10 Client accounts
  • 30 Charts per dashboard
+15 more
  • Unlimited Data sources
  • Auto-refresh data Every 6 hours
  • 3 Team members
  • 2k monthly AI assistant credits
  • API automation
  • Dashboard snapshots Every X days
  • Slack AI agent 1 workspace
  • Webhooks support
  • Chart Slack alerts
  • Anomaly detection
  • Chart email alerts
  • Embed charts
  • Embed reports
  • Fast email support
  • Discord support
Growth

$83 / month

  • 100 Dashboards
  • 200 Client accounts
  • 60 Charts per dashboard
+17 more
  • Unlimited Data sources
  • Auto-refresh data Every 1 hour
  • 10 Team members
  • 10k monthly AI assistant credits
  • API automation
  • Dashboard snapshots Every X hours
  • Slack AI agent Unlimited workspaces
  • Webhooks support
  • Chart Slack alerts
  • Anomaly detection
  • Chart email alerts
  • Embed charts
  • Embed reports
  • Removable brand
  • Fast email support
  • Discord support
  • Video call support
Professional

$333 / mo

  • 1000 Dashboards
  • Unlimited Client accounts
  • 120 Charts per dashboard
+17 more
  • Unlimited Data sources
  • Auto-refresh data Every 10 minutes
  • Unlimited Team members
  • 50k monthly AI assistant credits
  • API automation
  • Dashboard snapshots Every X minutes
  • Slack AI agent Unlimited workspaces
  • Webhooks support
  • Chart Slack alerts
  • Anomaly detection
  • Chart email alerts
  • Embed charts
  • Embed reports
  • Removable brand
  • Fast email support
  • Discord support
  • Video call support
Enterprise

Contact us

  • Unlimited accounts, dashboards, charts
  • Custom integrations
  • Priority support
+2 more
  • Custom SLA & compliance options
  • On-premise deployment options

Is Chartbrew worth the price?

Good value

Chartbrew's pricing is quite competitive, especially for the Starter and Growth tiers.

It appears to be a good value for businesses needing robust reporting and dashboard capabilities without breaking the bank.

Full Chartbrew pricing: every plan, hidden costs and alternatives

How Chartbrew's pricing compares

At $41/mo, Chartbrew is mid-range of its 4 comparable direct competitors ($25 to $812/mo across the set).

$29
Chartbrew
$41

Entry paid plan of each tool, price per month. Pricing checked Nov 12, 2026.

Email me when Chartbrew changes its price

We email you when Chartbrew changes its pricing. We read its pricing page every week. One email per change, unsubscribe any time.

Have an account? Sign in and it is on in one click.

Recent pricing updates

Changes we detected on the Chartbrew pricing page.

  • Starter went from $24 to $41 a month; Professional went from $249 to $333 a month.

Reviews
Improve Your Thinking Patterns Using ChatGPT cover
$99 Free with your review

Write the first Chartbrew review, get a free AI guide

Share your experience and we will send you Improve Your Thinking Patterns Using ChatGPT, free.

Write the first review

Best Chartbrew Alternatives

Top alternatives based on features, pricing, and user needs.

Chartbrew by the numbers

Toolradar data: Chartbrew's entry paid plan ($41/mo) ranks #4 of 11 for price among the Data Visualization tools with a verified entry price that is one price, not per user, where the median is $79/mo. As of Nov 2026.

Chartbrew compared with 145 Data Visualization tools on Toolradar, as of Nov 2026
Metric Chartbrew Peer median Position (1 is best)
Entry paid plan $41/mo $79/mo #4 of 11 tools with one price, not per user, verified price
Free plan No 50% have one n/a

Each position is counted among the tools that have data for that row, as noted under it. A lower entry price ranks higher; prices are read on vendor pages and compared only with tools priced on the same basis. All Data Visualization data · How we compute this. Advertising and placement fees are not inputs to any position.

Cite this: Toolradar, “Chartbrew by the numbers”, Nov 2026.

Most buyers shortlist 2 or 3 tools before committing. Pull a side-by-side comparison or browse the full alternatives shortlist below.

Explore More

Chartbrew FAQ

How does Chartbrew streamline client reporting for agencies?

Chartbrew streamlines client reporting by enabling users to build branded dashboards, utilize report templates, and embed real-time analytics directly into existing applications. This allows agencies to share insights efficiently and scale their client reporting processes.

Which teams benefit most from using Chartbrew?

Chartbrew is designed for small teams tracking KPIs, growing businesses needing advanced dashboards and scalable client reporting, and agencies or SaaS teams managing multiple clients and large datasets. It helps these teams move beyond manual reporting methods to dynamic, real-time solutions.

How does Chartbrew compare to Whatagraph for data visualization?

Chartbrew centralizes data from various sources and offers an AI assistant to facilitate data exploration and visualization, making analysis accessible even to non-technical users. It also provides flexible embedding options for integrating analytics into existing applications, which helps in scaling client reporting.

What kind of limitations should users consider when evaluating Chartbrew?

Users should be aware that Chartbrew does not offer a permanently free plan, only a 14-day free trial. Additionally, achieving a completely free and unlimited experience requires self-hosting the platform.

How is Chartbrew priced?

Chartbrew has no free plan. Its entry paid plan, Starter, is $41/mo. A free trial is available.

Can Chartbrew's AI assistant help with SQL database queries?

Yes, Chartbrew's AI assistant is capable of optimizing queries for SQL-based databases and MongoDB. This feature allows users to explore data and generate charts through natural language conversations, making data analysis more accessible.

Does Chartbrew support embedding interactive dashboards into other applications?

Yes, Chartbrew offers flexible embedding options that allow users to integrate real-time analytics and interactive dashboards into existing applications. This feature is particularly useful for sharing insights with clients or stakeholders directly within their platforms.

How does Chartbrew pricing compare with other Data Visualization tools?

Chartbrew's entry paid plan ($41/mo) ranks #4 of 11 for price among the Data Visualization tools with a verified entry price that is one price, not per user, where the median is $79/mo. Prices are read on each vendor's own pricing page and compared only with tools priced on the same basis. Source: Toolradar, Nov 2026.

Does Chartbrew have a promo code or discount code?

As of November 12, 2026, Toolradar has no Chartbrew promo code, coupon or discount code on file. Chartbrew's own pricing page (https://chartbrew.com/pricing, read November 12, 2026) does list a 14-day free trial, so you can start without a code. Offers change, so confirm the terms at checkout.

Guides & Articles